


Study of hydrological processes using remote sensing methods began in our country in 50-70s of the XX century. This article provides examples of using space images by specialists of the Department of Land Hydrology at the MSU (Moscow State University) for a variety of water bodies and hydrological processes and phenomena.
Remote detection of river flows properties
Definition of water discharge Great opportunities of remote sensing methods application are related to their use in evaluation of the water discharge. For this purpose the satellite imagery data are used to precisely estimate location of the lateral boundaries of the flow water surface and the water table acreage Fвп. Application of these technologies has proven to be most effective for the areas of branching channels where the distribution of the water discharge through the river arms can in many cases be examined solely based on special models [1].
Study of river water quality. Remote monitoring of river water quality is exceptionally promising. The majority of remote methods to determine optical properties of water bodies (e.g., optical T turbidity, NTU and weight s, mg/l) are based on their empirical correlation with water surface brightness DN and its derivatives (coefficient of spectral brightness Li and spectral reflectance ρ*):
Х (DN, Li, ρ*) = f(T, s, … ).
Each elementary cell of the image (pixel) is characterized by brightness (intensity) values, which are converted into the coefficients of the spectral brightness, which depend on the content of suspended particles in the water. Varying reflectance of clean water and water containing suspended particles, allows quantifying the turbidity based on satellite images. Regression dependences link optical turbidity with the values of the spectral brightness coefficients of one spectrum:
sSC = f(Liλ),
where Li λ – is the coefficient of the spectral brightness, received in the spectrum with a wavelength of λ. For this purpose one can use multispectral regressions as well:
sSC = f(Liλ1 , Liλ2, …, Liλn),
where λ 1 , …, Λ n – is the wavelength of different spectral bands used by concrete equipment.
Remote methods enabled to water get turbidity maps of rivers within Selenga River basin and to characterize the distribution of turbidity and suspended sediments transport rates in the delta water streams and the rivers confluence nodes. We used this as a background to study the structure of river waters mixing zones below the confluence nodes of Selenga River and its major tributaries in the different water regime phases (Fig. 1). Hydrodynamic effect of branched channels was detected, associated with the slowdown in the mixing of water masses and the extension of mixing zones. Selenga delta marginal effect quantitative characteristics were demonstrated, in particular, the longitudinal decrease in river waters turbidity by 2-3 times and deposition of more than 50% of the total suspended sediments runoff, coming to the delta head.
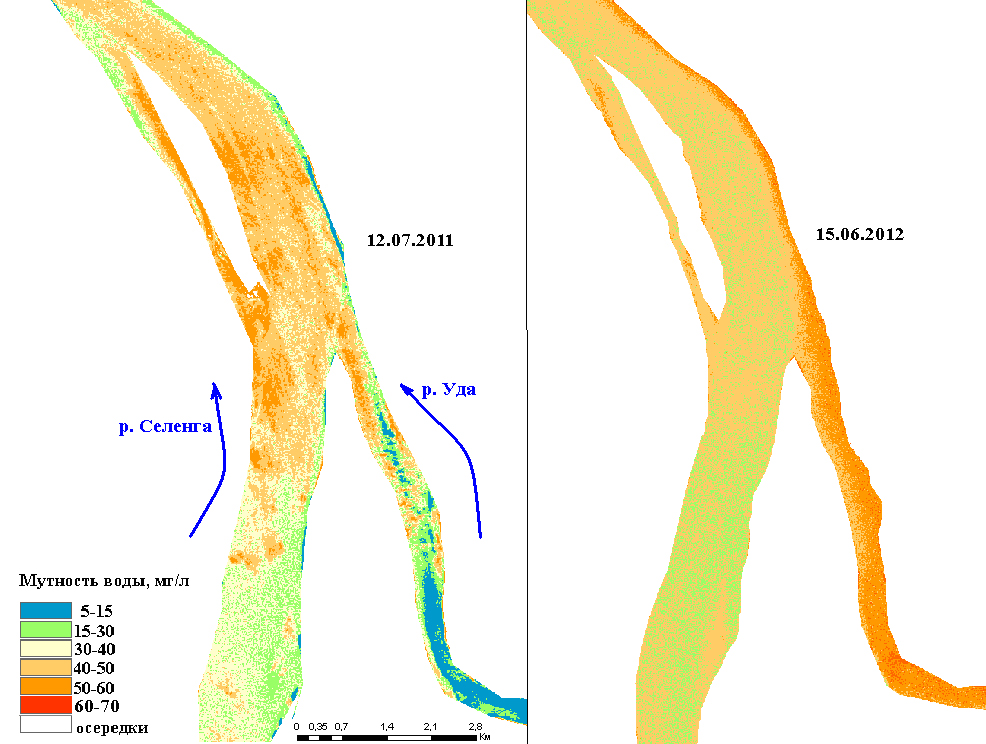
Fig. 1. Distribution of water turbidity in the node of Selenga River confluence with Uda River
Remote Sensing enabled to study these complex processes in the deficit of hydrological information and remoteness of some areas. The information obtained therewith is necessary to study all kinds of estuarine processes, including their dangerous manifestations.
It is necessary to verify the boundaries of estuarine areas and their morphometric characteristics. The appearance of high-definition imagery, modern digital elevation models based on interpreted images (SRTM), in combination with cartographic material and ground field surveys, allows you to specify the boundaries of the main elements of the rivers’ estuarine areas: the delta itself, delta offshore area, near-delta river area and a local catchment area [2].
Satellite-based research methods allow you to explore the dynamics of the delta sea boundaries. Analysis of the delta sea boundaries dynamics is particularly urgent for rivers flowing into water reservoirs with a varying level. This analysis is enabled by combining multi-temporal images and maps.
Multi-arm river deltas have a complicated, changing in time structure of the delta water courses. Determination of watercourses structure parameters (their number, number of branching and confluence nodes, levels of subdivisions, density) based on the topographic maps is almost impossible.
Riverbed deformations in river deltas are studied applying remote methods based on the same techniques as for river sections upstream estuarine areas. This enables to identify trends in the development of the delta water courses, signs of their fading away or intensification, direction of horizontal deformations, to evaluate the intensity of coasts erosion or the accumulation of river deposits.
Waterlogging of deltaic spaces during the seasonal floods, flash floods, surges, positive surges, jams and ice jams is one of the most complicated estuarine processes. It is extremely time-consuming and complicated in terms of determination of its quantitative characteristics. For some deltas in Russia (Volga River, etc.) the process studies used to be based on aerial photo surveys, aero-visual and natural studies. Currently such kind of work is practically never carried out and space methods have been increasingly wider used instead. Obtained results is the only way to quickly get some quantitative and reasonably accurate information about deltas flooding.
One of the least studied processes in river estuaries is the transformation of turbidity from the delta head to its mouth. Remote sensing techniques, capable of recording differences in spectral brightness between river and sea waters with different content of suspended particles, allow getting the big picture of turbidity distribution throughout deltas, as well as its changes at different distances from the delta’s sea edge (Fig. 2). For this purpose, in addition to space images one needs to have ground truth (actual) water turbidity measurements. They are required to verify the dependencies of turbid water spectral brightness on its value, their subsequent use for solving inverse problems: determination of turbidity by the spectral brightness value. In the absence of actual turbidity values, one can use the ratio between the brightness properties of images and the changing water flow rates at the delta head. If there is a clear relationship between turbidity and water flow rates, the transition to the desired water turbidity values is possible in other delta areas and the delta offshore areas.
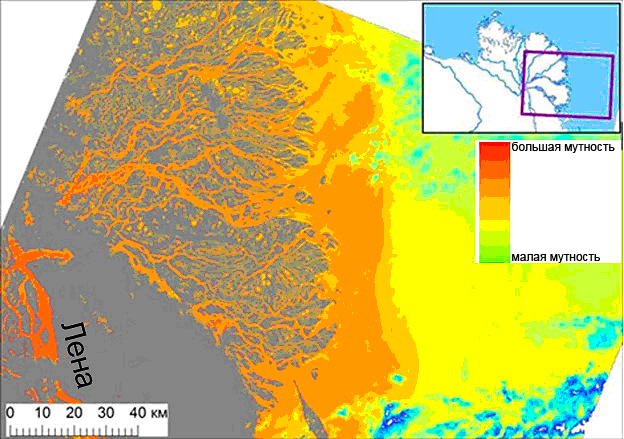
Fig. 2 – Zones of changed water turbidity in the eastern part of the Lena River delta area
River basins water balance properties evaluation. To solve this task, a rare method of measuring the temporal variations of the gravity field is used in our country, applying GRACE satellite system (Germany- United States) [4]. Structurally, it consists of two satellites, flying at a distance of 220 ± 50 km on one and the same low orbit (about 500 km). The distance measured between satellites is a reference value that contains information about the gravitational field. Studies have shown that monthly changes of the Earth gravitational field on land can largely be attributed to the movement of water masses within the continental part of the hydrological cycle. Currently the GRACE project performs global monitoring of water supplies changes within monthly intervals based on satellite technology and with various spatial resolutions, required to cover either large river basins (> 200000 km2) or entire continents. Monthly water reserves changes on land received by GRACE project, enabled to count the most important components of the hydrological cycle, including gross evaporation, runoff, precipitation minus evaporation (P-E), changes in groundwater reserves, as well as, most importantly, the discrepancy of a water balance in different scales. The gravimetric information we have processed is presented in the form of data about an equivalent level of water and their anomalies (Fig. 3). It is possible to trace the seasonal and long-term behavior of moisture reserves in river basins, to highlight extreme hydrological situations (for example, a significant snow accumulation in the spring of 2013 on the European part of Russia, lack of water in 2010 2014 in the Volga River basin and others; flood on the Amur River and preceding high water levels after spring floods). The data obtained are in good agreement with the fields of anomalies of seasonal and monthly surface air temperature and rivers runoff data. Accurate physical interpretation of received signals from satellites requires comparison with hydrological models (GLDAS, WGHM) and ground observations. Both the previous researchers’ data [3] and our estimates of water reserves changes applying the GRACE method have shown their good consistency with hydrological land surface models.
Conclusions. Remote identification of hydrological characteristics of rivers (water levels and flow rates, its turbidity, color organics content in the water) allow based on remote sensing data to receive arrays of indirect hydrological data for river sections, unexplored in hydrometrical terms.
When exploring estuaries in modern conditions, we believe that the most efficient is the use of remote sensing methods due to the inaccessibility of the territories under study, insufficient data about them and the lack of field data. To study the dynamics of the sea boundaries of delta, riverbed processes, dynamics of a hydrographic network, its structural features, it is enough to have a visual interpretation using the simplest features of panchromatic images automatic processing. When studying more complex processes (flooding of deltas, plumes, etc.) the best proven methods are those of computer-based automatic interpretation of multispectral images using specialized satellite data processing programs. When doing ground surveys it’s better to apply classification methods with teaching based on reference points.
For large areas satellite-based gravimetry represents an important source of getting varied geophysical data, including hydrological one. GRACE data can be used to assess changes in water resources of the major river basins and areas under the influence of climatic and human-induced factors. Remote sensing data is in good agreement with the data of hydrological models and in-situ measurements of streamflow values for certain periods of time.
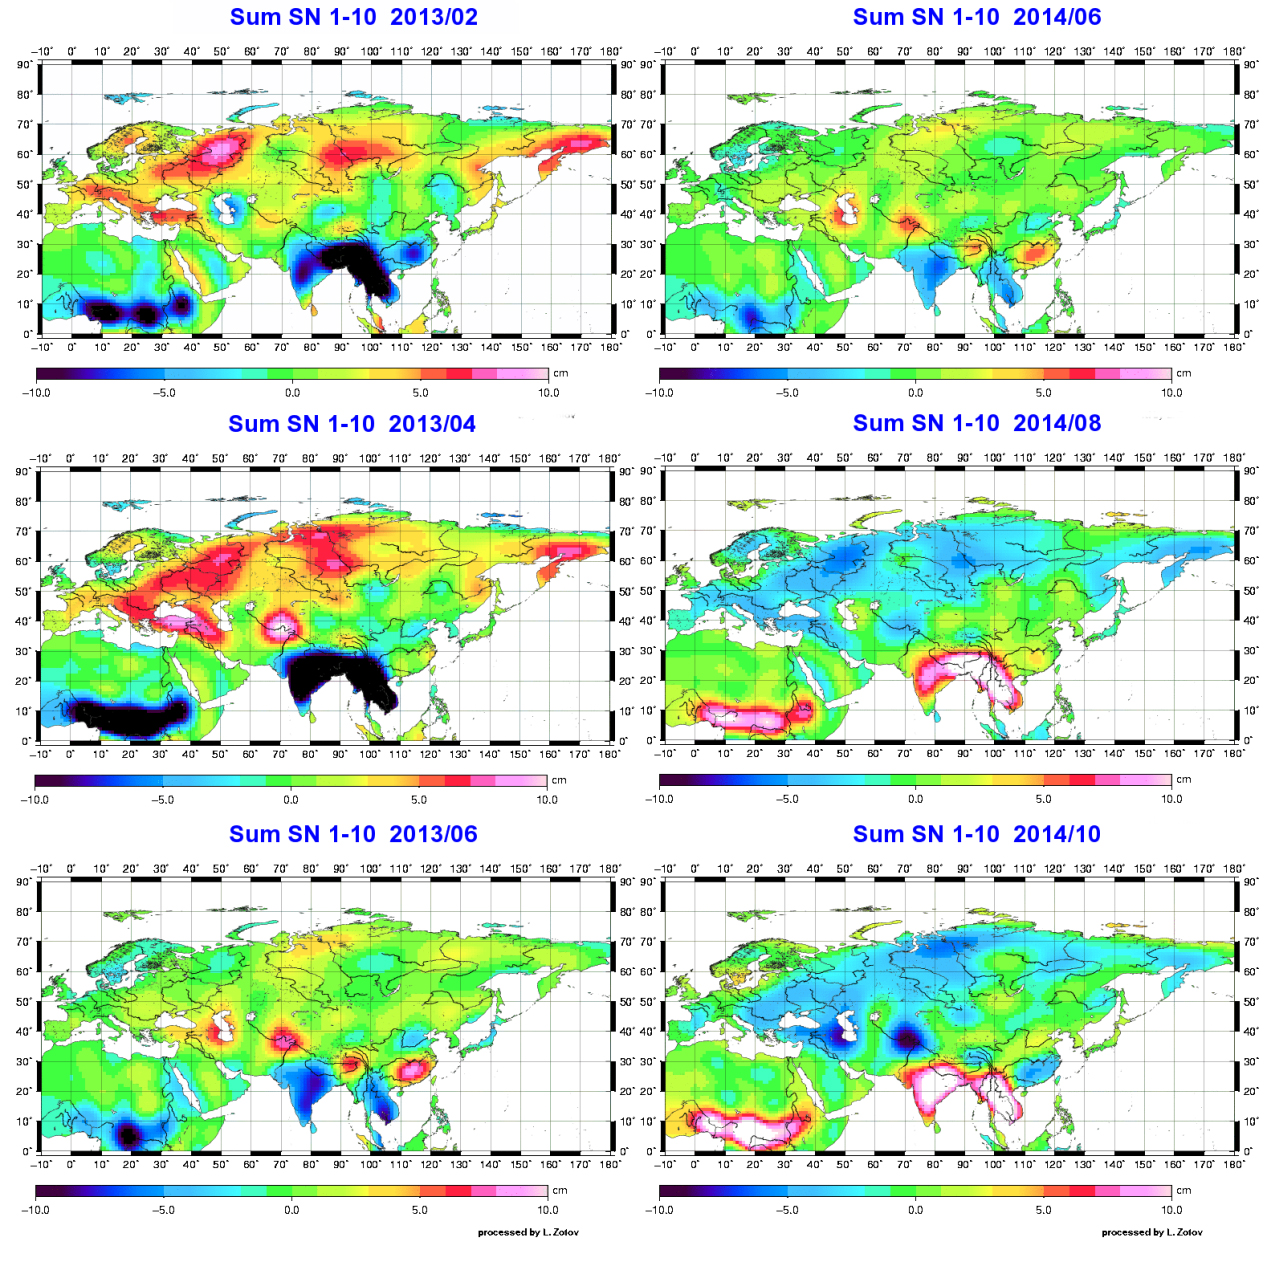
Fig. 3. Monthly maps of total moisture content anomalies according to GRACE data for February, April, June 2013 and June, August, October, 2014. Volumes excess is visible in the spring of 2013, and volumes lack – in the fall of 2014.
This article was published in «Earth from Space» journal
Relative posts


Comments